BLAST with Allinea Performance Reports
Simple example of using
BLAST
with Allinea Performance Reports (perf-report) on Crane is shown below:
blastn_perf_report.submit
#!/bin/bash
#SBATCH --job-name=BlastN
#SBATCH --nodes=1
#SBATCH --ntasks=16
#SBATCH --time=20:00:00
#SBATCH --mem=50gb
#SBATCH --output=BlastN.info
#SBATCH --error=BlastN.error

module load allinea
module load blast/2.2.29

cd $WORK/<project_folder>
cp -r /work/HCC/DATA/blastdb/nt/ /tmp/
cp input_reads.fasta /tmp/

perf-report --openmp-threads=$SLURM_NTASKS_PER_NODE --nompi `which blastn` \
-query /tmp/input_reads.fasta -db /tmp/nt/nt -out \
blastn_output.alignments -num_threads $SLURM_NTASKS_PER_NODE

cp blastn\_output.alignments .
BLAST uses OpenMP and therefore the Allinea Performance Reports options
--openmp-threads and --nompi are used. The perf-report
part, perf-report --openmp-threads=$SLURM_NTASKS_PER_NODE --nompi,
is placed in front of the actual blastn command we want
to analyze.
Note
If you see the error "Allinea Performance Reports - target file 'application' does not exist on this machine... exiting", this means that instead of just using the executable 'application', the full path to that application is required. This is the reason why in the script above, instead of using "blastn", we use `which blastn` which gives the full path of the blastn executable.
When the application finishes, the performance report is generated in the working directory. For the executed application, this is how the report looks like:
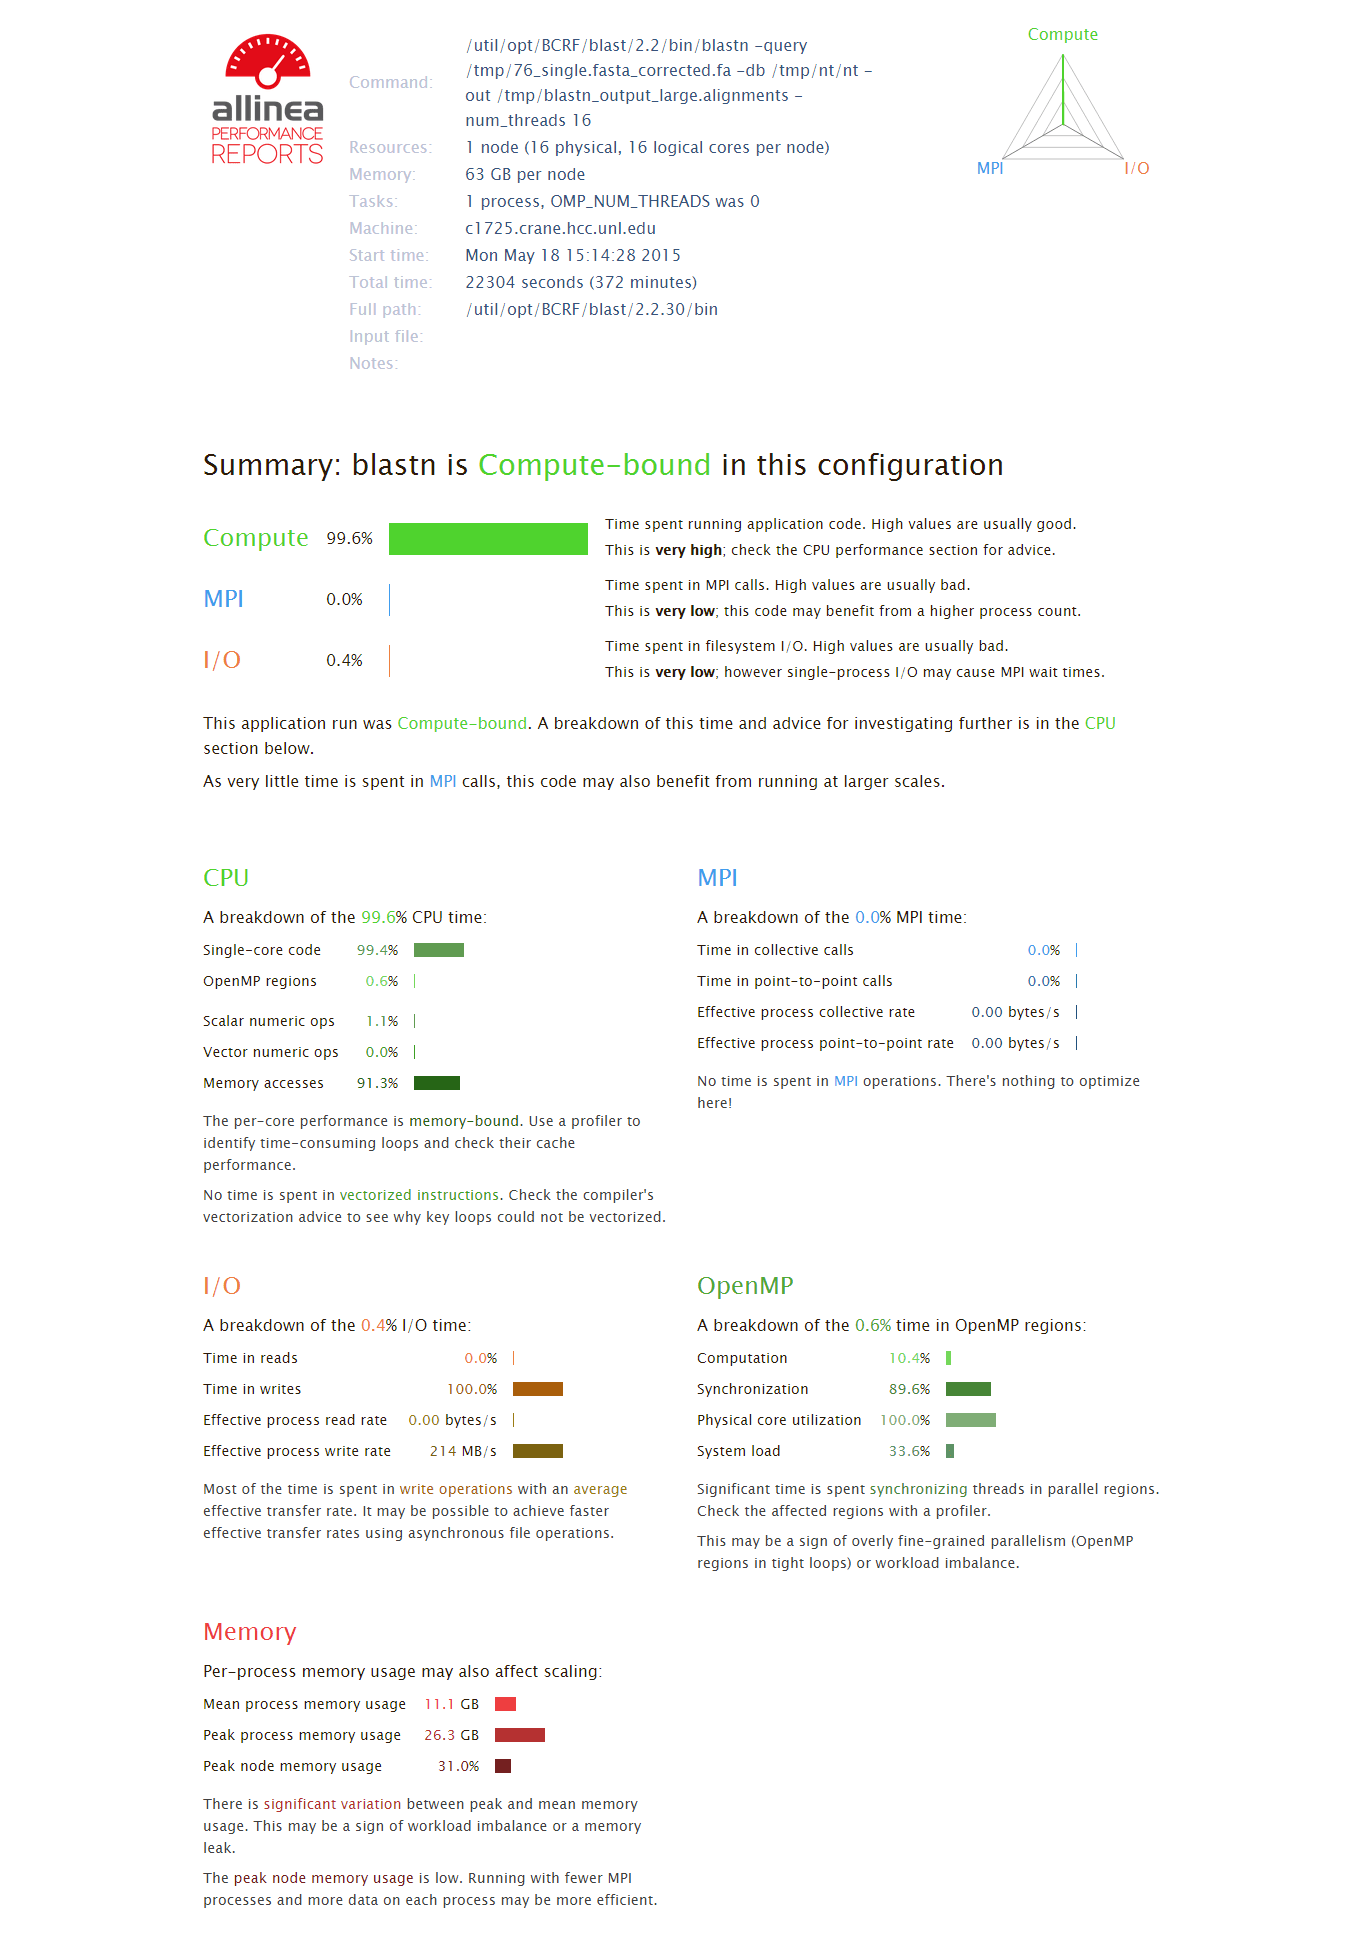
From the report, we can see that blastn is Compute-Bound application. The difference between mean (11.1 GB) and peak (26.3 GB) memory is significant, and this may be sign of workload imbalance or a memory leak. Moreover, 89.6% of the time is spent in synchronizing threads in parallel regions which can lead to workload imbalance.
Running Allinea Performance Reports and identifying application bottlenecks is really useful for improving the application and better utilization of the available resources.