Monitoring Jobs
Careful examination of running times, memory usage and output files will allow you to ensure the job completed correctly and give you a good idea of what memory and time limits to request in the future.
Monitoring Completed Jobs:
seff
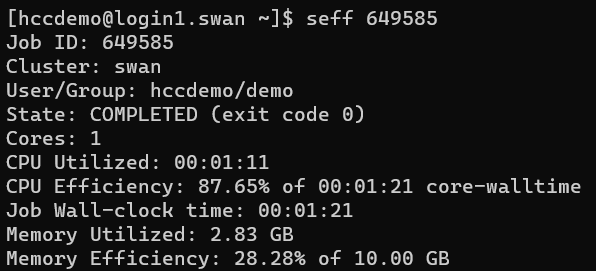
The seff command provides a quick summary of a single job's resource utilization and efficiency after it has been completed, including status, wall usage, runtime, and memory usage of a job:
seff <JOB_ID>
[hccdemo@login1.swan ~]$ seff 649585
Job ID: 649585
Cluster: swan
User/Group: hccdemo/demo
State: COMPLETED (exit code 0)
Cores: 1
CPU Utilized: 00:01:11
CPU Efficiency: 87.65% of 00:01:21 core-walltime
Job Wall-clock time: 00:01:21
Memory Utilized: 2.83 GB
Memory Efficiency: 28.28% of 10.00 GB
Note
seffgathers resource utilization every 30 seconds, so it is possible for some peak utilization to be missed in the report.- For multi node jobs, the
Memory Utilizedreported byseffis for one node only. For more accurate report, please usesacctinstead.
sacct
To see the runtime and memory usage of a job that has completed, use the sacct command:
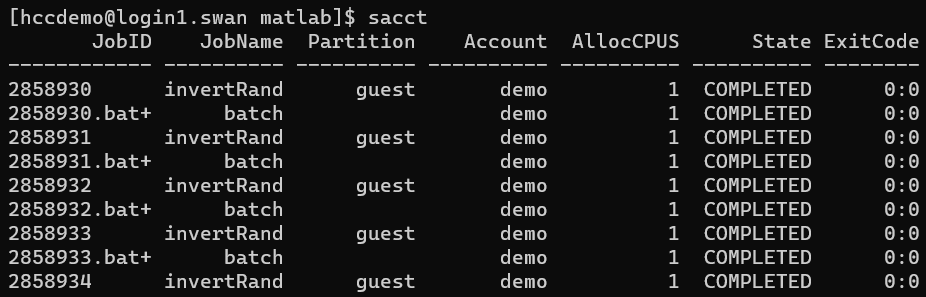
sacct
Lists all jobs by the current user and displays information such as JobID, JobName, State, and ExitCode.
[hccdemo@login1.swan matlab]$ sacct
       JobID    JobName  Partition    Account  AllocCPUS      State ExitCode
------------ ---------- ---------- ---------- ---------- ---------- --------
2858930      invertRand      guest       demo          1  COMPLETED      0:0
2858930.bat+      batch                  demo          1  COMPLETED      0:0
2858931      invertRand      guest       demo          1  COMPLETED      0:0
2858931.bat+      batch                  demo          1  COMPLETED      0:0
2858932      invertRand      guest       demo          1  COMPLETED      0:0
2858932.bat+      batch                  demo          1  COMPLETED      0:0
2858933      invertRand      guest       demo          1  COMPLETED      0:0
2858933.bat+      batch                  demo          1  COMPLETED      0:0
2858934      invertRand      guest       demo          1  COMPLETED      0:0
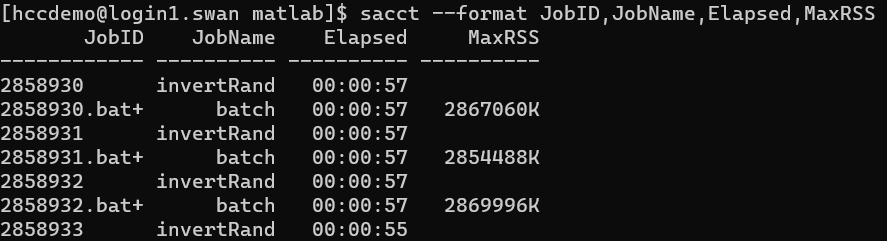
Coupling this command with the --format flag will allow you to see more than the default information about a job. Fields to display should be listed as a comma separated list after the --format flag (without spaces). For example, to see the Elapsed time and Maximum used memory by a job, this command can be used:
sacct --format JobID,JobName,Elapsed,MaxRSS
[hccdemo@login1.swan matlab]$ sacct --format JobID,JobName,Elapsed,MaxRSS
       JobID    JobName    Elapsed     MaxRSS
------------ ---------- ---------- ----------
2858930      invertRand   00:00:57
2858930.bat+      batch   00:00:57   2867060K
2858931      invertRand   00:00:57
2858931.bat+      batch   00:00:57   2854488K
2858932      invertRand   00:00:57
2858932.bat+      batch   00:00:57   2869996K
2858933      invertRand   00:00:55
Additional arguments and format field information can be found in the SLURM documentation.
Monitoring Running Jobs:
There are two ways to monitor running jobs, the top command and
monitoring the cgroup files using the utilitycgget. top is helpful
when monitoring multi-process jobs, whereas the cgroup files provide
information on memory usage. Both of these tools require the use of an
interactive job on the same node as the job to be monitored while the job
is running.
Warning
If the job to be monitored is using all available resources for a node, the user will not be able to obtain a simultaneous interactive job.
After the job to be monitored is submitted and has begun to run, request an interactive job on the same node using the srun command:
srun --jobid=<JOB_ID> --pty bash
where <JOB_ID> is replaced by the job id for the monitored job as
assigned by SLURM.
Alternately, you can request the interactive job by nodename as follows:
srun --nodelist=<NODE_ID> --pty bash
where <NODE_ID> is replaced by the name of the node where the monitored
job is running. This information can be found out by looking at the
squeue output under the NODELIST column.

[hccdemo@login1.swan matlab]$ squeue -u hccdemo
             JOBID PARTITION     NAME     USER ST       TIME  NODES NODELIST(REASON)
           2858956     guest invertRa  hccdemo  R       0:11      1 c2125
[hccdemo@login1.swan matlab]$
Using top to monitor running jobs
Once the interactive job begins, you can run top to view the processes
on the node you are on:
top - 14:22:31 up 7 days, 21:16,  0 users,  load average: 1.85, 2.04, 1.64
Tasks: 812 total,   3 running, 809 sleeping,   0 stopped,   0 zombie
%Cpu(s):  8.1 us,  1.0 sy,  0.0 ni, 89.9 id,  0.8 wa,  0.1 hi,  0.1 si,  0.0 st
MiB Mem : 256738.5 total, 247767.9 free,   4959.9 used,   4010.8 buff/cache
MiB Swap:      0.0 total,      0.0 free,      0.0 used. 250108.0 avail Mem

    PID USER      PR  NI    VIRT    RES    SHR S  %CPU  %MEM     TIME+ COMMAND
1736758 hccdemo   20   0 5940976   1.1g 191832 S 135.9   0.4   0:04.57 MATLAB
1736757 hccdemo   20   0 5938428   1.1g 192432 S 135.2   0.4   0:04.54 MATLAB
1736756 hccdemo   20   0 6004472   1.1g 192460 S 134.9   0.4   0:04.53 MATLAB
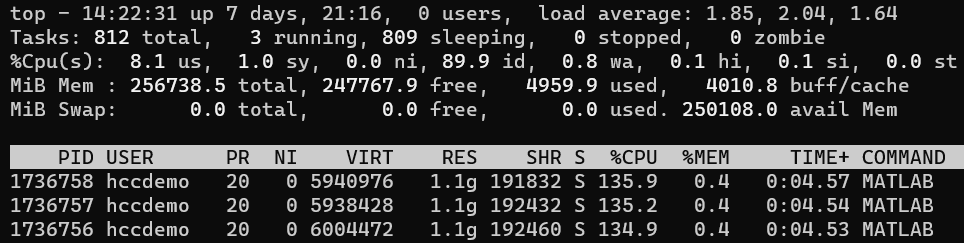
Output for top displays each running process on the node. From the above
image, we can see the various MATLAB processes being run by user
hccdemo. To filter the list of processes, you can type u followed
by the username of the user who owns the processes. To exit this screen,
press q.
Using cgget to monitor running jobs
During a running job, the cgroup folder is created on the node where the job
is running. This folder contains much of the information used by sacct.
However, while sacct reports information gathered every 30 seconds, the
cgroup files are updated more frequently and can detect quick spikes in
resource usage missed by sacct. Thus, using the cgroup files can give more
accurate information, especially regarding the RAM usage.
One way to access the cgroup files with cgget, is to start an interactive job
on the same node as the monitored job. Then, to view specific files and information,
use one of the following commands:
To view current memory usage:
cgget -r memory.usage_in_bytes /slurm/uid_<UID>/job_<SLURM_JOBID>/
where <UID> is replaced by your UID and <SLURM_JOBID> is
replaced by the monitored job's Job ID as assigned by SLURM.
Note
To find your uid, use the command id -u. Your UID never changes and is the same on all HCC clusters (not on Anvil, however!).
To view the total CPU time, in nanoseconds, consummed by the job:
cgget -r cpuacct.usage /slurm/uid_<UID>/job_<SLURM_JOBID>/
Since the cgroup files are available only during the job is running, another
way of accessing the information from these files is through the submit job.
To track for example, the maximum memory usage of a job, you can add
cgget -r memory.max_usage_in_bytes /slurm/uid_${UID}/job_${SLURM_JOBID}/
UID and SLURM_JOBID are variables that will be set
when the job is submitted.
For information on more variables that can be used with cgget, please check here.
We also provide a sciprt, mem_report, that reports the current and maximum
memory usages for a job. This script is wrapper for the cgget commands shown above
and generates user-friendly output. To use this script, you need to add
mem_report
mem_report can also be run as part of an interactive job:
[demo13@c0218.swan ~]$ mem_report
Current memory usage for job 25745709 is: 2.57 MBs
Maximum memory usage for job 25745709 is: 3.27 MBs
When cgget and mem_report are used as part of the submit script, the respective output
is printed in the generated SLURM log files, unless otherwise specified.
Monitoring queued Jobs:
The queue on Swan is a fair-share, which means your jobs priority depends on how long the job has been waiting in the queue, past usage of the cluster, your job size, memory and time requested, etc. Also this will be affected by the amount of jobs waiting on the queue and how much resources are available on the cluster. The more you submitted jobs on the queue the lower priority to run your jobs on the cluster will increase.
You can check when your jobs will be running on the cluster using the command:
sacct -u <user_id> --format=start
To check the start running time for a specific job then you can use the following command:
sacct -u <user_id> --job=<job_id> --format=start
Finally, To check your fairsahre score by running the following command:
sshare --account=<group_name> -a
After you run the above command you will be able to see your fair-share score.
- If your fairshare score is 1.0, then it is indicate that your account has not run any jobs recently (unused).
- If your faireshare score is 0.5, then that means (Average utilization). The Account on average is using exactly as much as their granted Share.
- If your fairshae score is between 0.5 > fairshare > 0, that means (Higher than average utilization). The Account has overused their granted Share.
- Finally, if your fairshare score is 0. That means (No share left). The Account has vastly overused their granted Share. If there is no contention for resources, the jobs will still start.
Job Wait Time
Fairshare priority is not the only factor in how long a job takes to start. The SLURM scheduler needs to find a time where resources are available. Larger jobs or jobs requiring GPUs may take longer to start in queue while SLURM waits for resources to be available.
There is another way to run your job faster which is by having Priority Access.