LAMMPS with Allinea Performance Reports
Simple example of using LAAMPS
with Allinea Performance Reports (perf-report) on Crane is shown
below:
lammps_perf_report.submit
#!/bin/bash
#SBATCH --job-name=LAMMPS
#SBATCH --ntasks=64
#SBATCH --time=12:00:00
#SBATCH --mem=2gb
#SBATCH --partition=batch
#SBATCH --output=Lammps.%J.info
#SBATCH --error=Lammps.%J.error

module load allinea
module load compiler/gcc/4.8 openmpi/1.8
module load lammps/30Oct2014

perf-report --input=in.copper --np=64 `which lmp_ompi_g---`
LAMMPS runs on a single processor or in parallel using message-passing
interface, and therefore additional Allinea Performance Reports options
are not required. However, the input file for LAMMPS is read from
standard input. In this case, instead of using "<", Allinea
Performance Reports uses the option --input where the input file is
defined. Therefore, in the perf-report part we have perf-report
--input=in.copper, where in.copper is the input file used for
LAMMPS.
Note
If you see the error "Allinea Performance Reports - target file 'application' does not exist on this machine... exiting", this means that instead of just using the executable 'application', the full path to that application is required. This is the reason why in the script above, instead of using "lmp_ompi_g---", we use `which lmp_ompi_g---` which gives the full path of the LAMMPS executable.
When the application finishes, the performance report is generated in the working directory. For the executed application, this is how the report looks like:
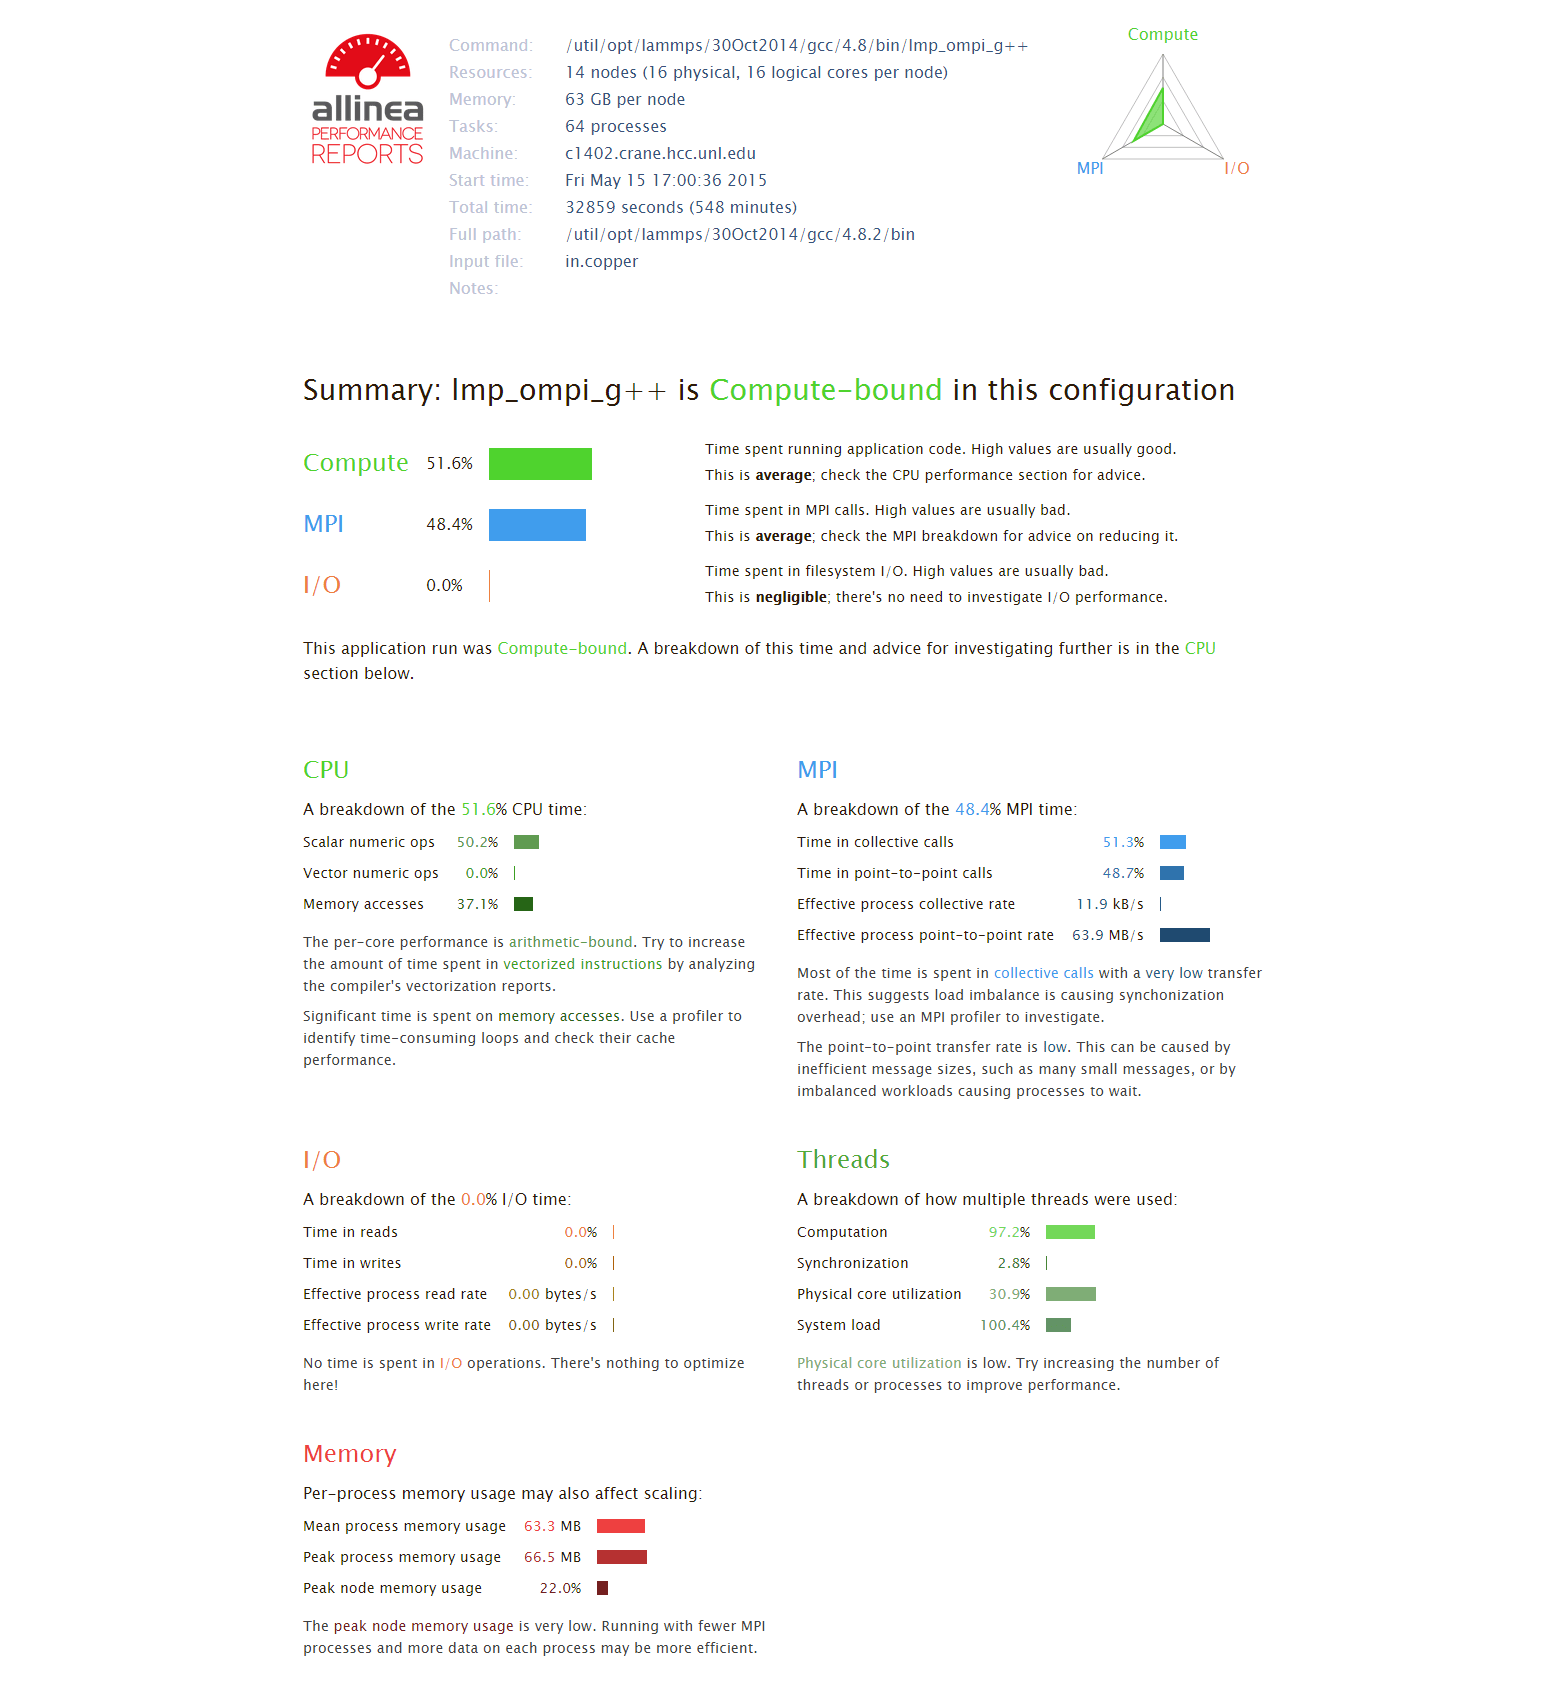
From the report, we can see that LAMMPS is Compute-Bound application. Most of the MPI communication is spent in collective calls with a very low transfer rate that suggests load imbalance. Alos, significant time is spent on memory accesses, and using a profiler may help identify time-consuming loops and check their cache performance.
Running Allinea Performance Reports and identifying application bottlenecks is really useful for improving the application and better utilization of the available resources.