Ray with Allinea Performance Reports
Simple example of using Ray
with Allinea PerformanceReports (perf-report) is shown below:
ray_perf_report.submit
#!/bin/bash
#SBATCH --job-name=Ray
#SBATCH --ntasks-per-node=16
#SBATCH --time=10:00:00
#SBATCH --mem=70gb
#SBATCH --output=Ray.info
#SBATCH --error=Ray.error

module load allinea
module load compiler/gcc/4.7 openmpi/1.6 ray/2.3

perf-report mpiexec -n 16 Ray -k 31 -p -p input_reads_pair_1.fasta input_reads\_pair_2.fasta -o output_directory
Ray is MPI and therefore additional Allinea Performance Reports options
are not required. The perf-report command is placed in front of the
actual Ray command we want to analyze.
When the application finishes, the performance report is generated in the working directory. For the executed application, this is how the report looks like:
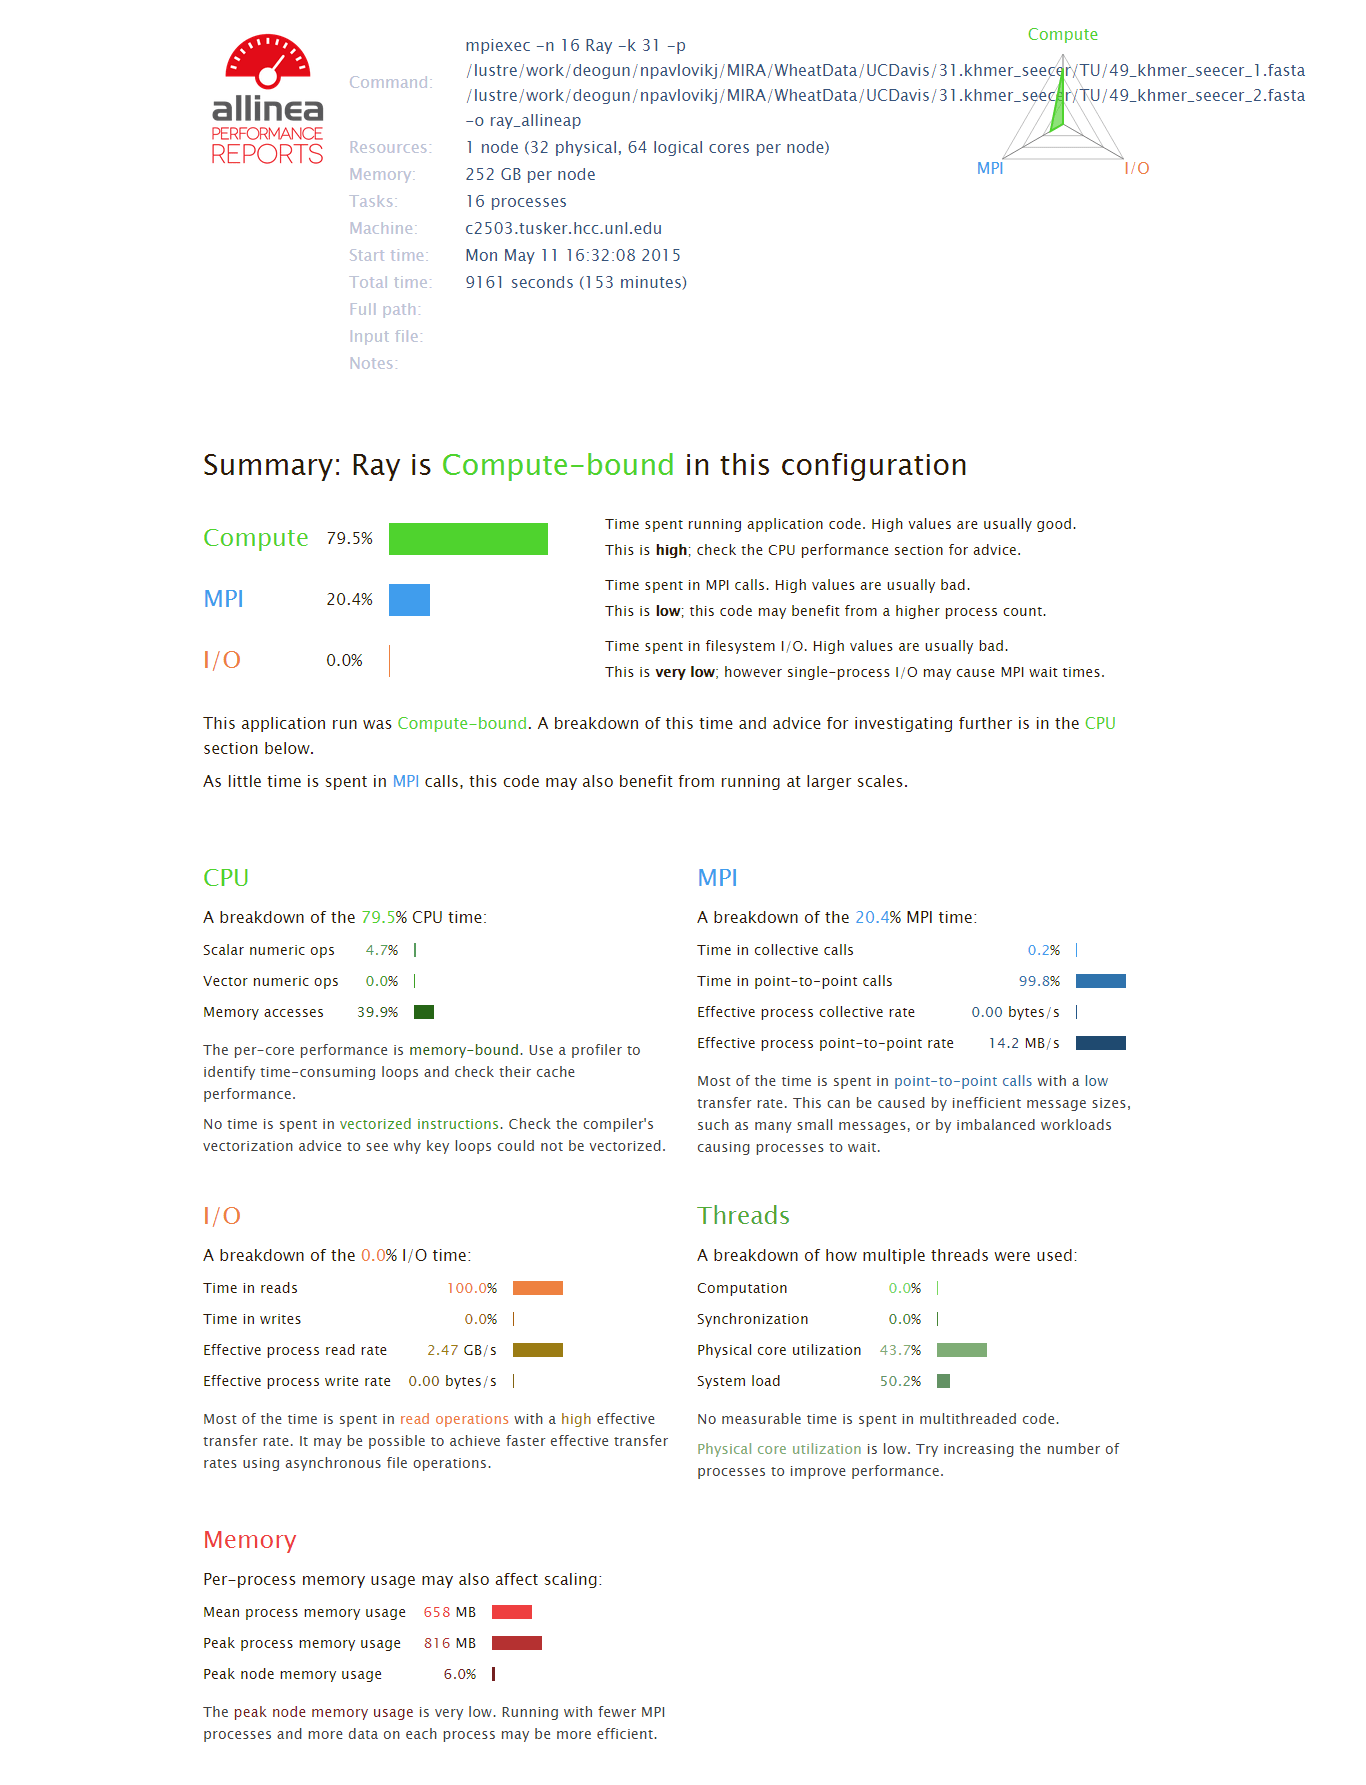
From the report, we can see that Ray is Compute-Bound application. Most of the running time is spent in point-to-point calls with a low transfer rate which may be caused by inefficient message sizes. Therefore, running this application with fewer MPI processes and more data on each process may be more efficient.
Running Allinea Performance Reports and identifying application bottlenecks is really useful for improving the application and better utilization of the available resources.